Where is ESTR? (3)
This is a follow up on previous post on Where is ESTR? and Where is ESTR? (2)
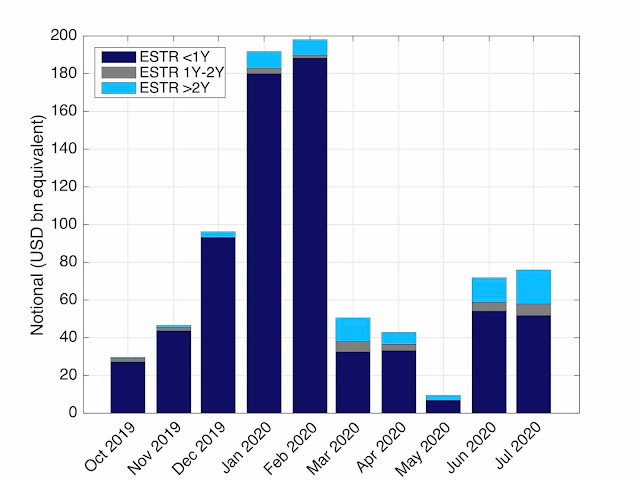
This means a total volume for ESTR OIS of 640 bn since the start of the year. This is in contrast with the 53 trn in all OIS (EONIA and ESTR). ESTR-linked products are only 1.2% of all overnight-linked products.
The ISDA SwapsInfo weekly provides different figures, which are related to trade disclosed under US regulation only. In the last week, there were 20 new trades, this is around 20% of the number of trades since the beginning of the year. A big relative increase, but an increase from a irrelevant proportion to a slightly less irrelevant proportion.
In the mean time, the main CCPs have switch their PAI to ESTR in EUR and it should be the standard now. The July data includes one week in the new regime. What do we see in the LCH-cleared OTC data? Almost nothing! The monthly volume for ESTR OIS was 76 bn (USD equivalent), just above 1/3 of what is was in January and February (see graph below). Not a very positive trend.
Figure 1: Monthly ESTR volume at LCH.
This means a total volume for ESTR OIS of 640 bn since the start of the year. This is in contrast with the 53 trn in all OIS (EONIA and ESTR). ESTR-linked products are only 1.2% of all overnight-linked products.
The ISDA SwapsInfo weekly provides different figures, which are related to trade disclosed under US regulation only. In the last week, there were 20 new trades, this is around 20% of the number of trades since the beginning of the year. A big relative increase, but an increase from a irrelevant proportion to a slightly less irrelevant proportion.


Comments
Post a Comment