Spread, transition period, cliff-effect and manipulation

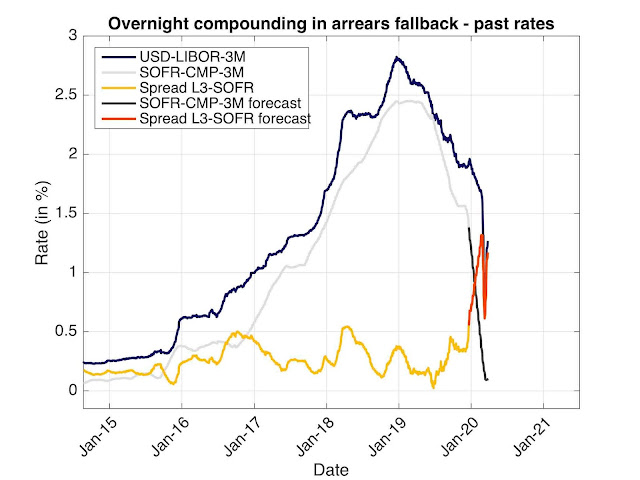
The recent volatility and blowout of the LIBOR/overnight-linked spread have reopened the question about the fallback transition period for the adjustment spread. In this post, I will reiterate my opinion on the issue, already expressed in a couple of notes (for example Section 4.2 in A Quant Perspective on IBOR Fallback Consultation Results , January 2019 ), blogs and panels. The current spread level and its evolution over the last 5 years is displayed in the graph below. This is the spread between the forward looking USD-LIBOR-3M and the backward looking SOFR compounded over the same period. The data points are aligned on the fixing date of LIBOR. The graph should end on 2019-12-20 as this is the last date for which we have the full compounded SOFR data. This is represented in yellow. Nevertheless we have LIBOR data for an extra 3 months and we have some ideas of where the SOFR could be fixing over that period. The red part of the graph represents that estimation build from known L...
