Spread, transition period, cliff-effect and manipulation
The recent volatility and blowout of the LIBOR/overnight-linked spread have reopened the question about the fallback transition period for the adjustment spread. In this post, I will reiterate my opinion on the issue, already expressed in a couple of notes (for example Section 4.2 in A Quant Perspective on IBOR Fallback Consultation Results, January 2019 ), blogs and panels.
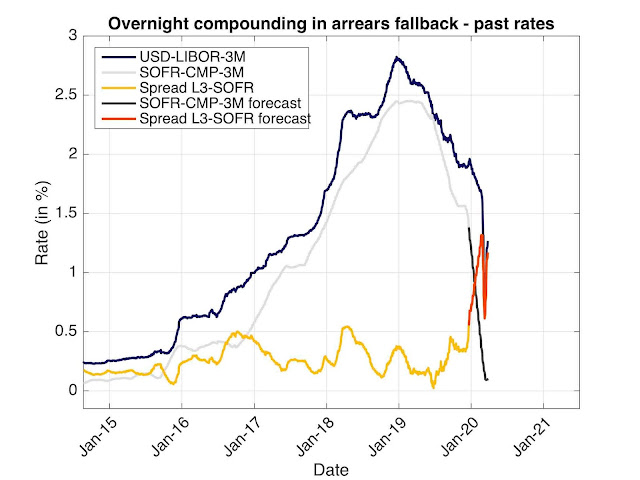
The current spread level and its evolution over the last 5 years is displayed in the graph below. This is the spread between the forward looking USD-LIBOR-3M and the backward looking SOFR compounded over the same period. The data points are aligned on the fixing date of LIBOR. The graph should end on 2019-12-20 as this is the last date for which we have the full compounded SOFR data. This is represented in yellow. Nevertheless we have LIBOR data for an extra 3 months and we have some ideas of where the SOFR could be fixing over that period. The red part of the graph represents that estimation build from known LIBOR fixing, partly of known SOFR fixings and partly of forecasted SOFR fixings. The forecasted SOFR fixing are obtained by calibrating a curve to OIS using piecewise constant forward rates between FOMC meeting date. A similar graph was proposed in Forward looking the spread between forward looking and backward looking rates a couple of weeks ago. Note the interesting forecasted dip in spread, a combination of credit risk and market misestimation.
Regarding the fallback transition period, I start with a one-line summary and then I justify it
How is it related to an actual economical reality? A LIBOR-linked financial contract is not linked to LIBOR in general, it is linked to a specific LIBOR fixing at a specific date. If the specific date is before the cessation, obviously there is no cliff-effect, usual LIBOR, usual fixing. And if the specific fixing date is after the cessation date? We expect the cessation to take place on 3 January 2022. The current value of the instrument is its expected pay-off, i.e. pay-off expected to be associated to RFR plus the spread computed from historical data. The LIBOR rate fixing for 31 December 2021, the last day before the cessation will have zero impact on that spread. If you take the fixing that happened three month before, it will have a very small impact on the spread, roughly 1/1260, like any other date in the last 5 years. I would not call that a cliff-effect. In term of valuation the spot-spread has no impact, so in no way it could create a cliff-effect. There is a step change in the LIBOR print, not in the LIBOR-indexed payoffs, not in the valuation. If there was any cliff-effect on valuation, it happened - in the past - on consultation announcement date, nothing will happen on cessation date if the date is known. This was no really a cliff-effect, but more a steep slope effect that lasted a couple of months as I have reported in several blogs and also reported in the press.
On the cliff-effect side, there are elements that have an effect and that have not been mentioned enough: announcement date and cessation date.
Announcement date: The spread is computed on the cessation announcement date. If the announcement was done tomorrow (unlikely with the crisis), all the crisis crazy numbers would not appear in the median (spread are calculated in-arrears, so only LIBOR from 3-months ago are included, only the yellow part of the above graph is included). See LIBOR fallback: a median in a crisis for more details. The announcement will be done likely by IBA when panel banks decide to withdraw en masse or, in the pre-cessation trigger case, by FCA if at least one panel bank member leaves. The option of the announcement is thus in the hands of the panel banks.
Then there is the cessation date cliff-effect. Is a fixing date after or before the cessation date? That is very important to know. This is the difference between the market spread or the fallback spread to be applied. For this cessation date cliff-effect, the proposed transition has a (positive) impact. It reduces the impact of the unknown date, the spread impact is only there as a second order. On the technical side, there is cliff-effect on the valuation methodology at the cessation date (from LIBOR to RFR + spread). That technical cliff-effect cannot be tackled by simply changing the curve, as described in LIBOR Fallback is not a curve change, its is a contract change!
But this reduction of impact by transition period comes at a high cost: potential manipulation. After the GFC, many banks have been accused of and fined for manipulating LIBOR. What type of manipulation? Changing their LIBOR submission for one day at a time, by one basis point or two, to suit their fixing positions for that day. What do we have with the proposed transition period? The fixing for one day will have an impact on the fixings for the next year, the whole 250+ of them. With one rate, you are able to impact 250 of them. With the decreasing weights, this is equivalent to 125 full weight fixing. If there was an incentive to manipulate LIBOR for one day, what is the incentive to manipulate LIBOR in one go for the equivalent of 125 days. Now you can replace "manipulate" by "abnormal market condition" and the intent is not the same, but the effect is the same. One day LIBOR fixing will have an impact on the next 250+ days of post-LIBOR fixings.
Note that in the initial ISDA consultation, a spot-spread approach was proposed. The transition period introduces, without saying it, a weighted scheme between the historical median approach and the spot-spread approach. The spot-spread approach was selected by only 4 out of the 142 respondents (and 42 respondent completely opposed to it). The main arguments against that approach were the impact of unusual market condition and potential manipulation. The same arguments are valid for the fallback transition period. Note also that ISDA considered that the compounding setting in arrears was incompatible with spot-spread approach. If ISDA is coherent, they should also consider the compounding setting in arrears incompatible with the transition period, as this period is equivalent to a weighted sum of historical and spot-spread approaches.
What is the impact on hedging from the transition period? It is good if the fixing dates in the hedge are close and some are before the discontinuation and others are after (date cliff-effect). The impact is bad if the fixing dates are in the transition period and LIBOR is hedged with ON derivatives (one specific day LIBOR volatility is exacerbated by the transition period).
Summary: There is no cliff-effect due to the spread when the cessation date is known, there is a cliff effect on the choice of announcement and cessation dates. The announcement date is an option in the hands of the panel banks. With the transition period, there is a risk of unusual market condition and potential manipulation, size 125, on the last fixing.
The current spread level and its evolution over the last 5 years is displayed in the graph below. This is the spread between the forward looking USD-LIBOR-3M and the backward looking SOFR compounded over the same period. The data points are aligned on the fixing date of LIBOR. The graph should end on 2019-12-20 as this is the last date for which we have the full compounded SOFR data. This is represented in yellow. Nevertheless we have LIBOR data for an extra 3 months and we have some ideas of where the SOFR could be fixing over that period. The red part of the graph represents that estimation build from known LIBOR fixing, partly of known SOFR fixings and partly of forecasted SOFR fixings. The forecasted SOFR fixing are obtained by calibrating a curve to OIS using piecewise constant forward rates between FOMC meeting date. A similar graph was proposed in Forward looking the spread between forward looking and backward looking rates a couple of weeks ago. Note the interesting forecasted dip in spread, a combination of credit risk and market misestimation.

Figure 1: Historical and forecasted spread LIBOR/SOFR Compounded setting in arrears.
Regarding the fallback transition period, I start with a one-line summary and then I justify it
There is no valuation cliff-effect on the cessation date due to fallback spread and a transition period open the door to manipulation.First the cliff-effect: When LIBOR is discontinued, there is an obvious cliff-effect: one day it exists, the next day it does not exists. But this is a theoretical visual cliff-effect, it is just a number not appearing on a screen, not an economical one. Similarly, if you do a graph of LIBOR fixing time series followed by RFR plus spread, you see a jump in the graph. This jump is only worth the paper on which the graph is printed.
How is it related to an actual economical reality? A LIBOR-linked financial contract is not linked to LIBOR in general, it is linked to a specific LIBOR fixing at a specific date. If the specific date is before the cessation, obviously there is no cliff-effect, usual LIBOR, usual fixing. And if the specific fixing date is after the cessation date? We expect the cessation to take place on 3 January 2022. The current value of the instrument is its expected pay-off, i.e. pay-off expected to be associated to RFR plus the spread computed from historical data. The LIBOR rate fixing for 31 December 2021, the last day before the cessation will have zero impact on that spread. If you take the fixing that happened three month before, it will have a very small impact on the spread, roughly 1/1260, like any other date in the last 5 years. I would not call that a cliff-effect. In term of valuation the spot-spread has no impact, so in no way it could create a cliff-effect. There is a step change in the LIBOR print, not in the LIBOR-indexed payoffs, not in the valuation. If there was any cliff-effect on valuation, it happened - in the past - on consultation announcement date, nothing will happen on cessation date if the date is known. This was no really a cliff-effect, but more a steep slope effect that lasted a couple of months as I have reported in several blogs and also reported in the press.
On the cliff-effect side, there are elements that have an effect and that have not been mentioned enough: announcement date and cessation date.
Announcement date: The spread is computed on the cessation announcement date. If the announcement was done tomorrow (unlikely with the crisis), all the crisis crazy numbers would not appear in the median (spread are calculated in-arrears, so only LIBOR from 3-months ago are included, only the yellow part of the above graph is included). See LIBOR fallback: a median in a crisis for more details. The announcement will be done likely by IBA when panel banks decide to withdraw en masse or, in the pre-cessation trigger case, by FCA if at least one panel bank member leaves. The option of the announcement is thus in the hands of the panel banks.
Then there is the cessation date cliff-effect. Is a fixing date after or before the cessation date? That is very important to know. This is the difference between the market spread or the fallback spread to be applied. For this cessation date cliff-effect, the proposed transition has a (positive) impact. It reduces the impact of the unknown date, the spread impact is only there as a second order. On the technical side, there is cliff-effect on the valuation methodology at the cessation date (from LIBOR to RFR + spread). That technical cliff-effect cannot be tackled by simply changing the curve, as described in LIBOR Fallback is not a curve change, its is a contract change!
But this reduction of impact by transition period comes at a high cost: potential manipulation. After the GFC, many banks have been accused of and fined for manipulating LIBOR. What type of manipulation? Changing their LIBOR submission for one day at a time, by one basis point or two, to suit their fixing positions for that day. What do we have with the proposed transition period? The fixing for one day will have an impact on the fixings for the next year, the whole 250+ of them. With one rate, you are able to impact 250 of them. With the decreasing weights, this is equivalent to 125 full weight fixing. If there was an incentive to manipulate LIBOR for one day, what is the incentive to manipulate LIBOR in one go for the equivalent of 125 days. Now you can replace "manipulate" by "abnormal market condition" and the intent is not the same, but the effect is the same. One day LIBOR fixing will have an impact on the next 250+ days of post-LIBOR fixings.
Note that in the initial ISDA consultation, a spot-spread approach was proposed. The transition period introduces, without saying it, a weighted scheme between the historical median approach and the spot-spread approach. The spot-spread approach was selected by only 4 out of the 142 respondents (and 42 respondent completely opposed to it). The main arguments against that approach were the impact of unusual market condition and potential manipulation. The same arguments are valid for the fallback transition period. Note also that ISDA considered that the compounding setting in arrears was incompatible with spot-spread approach. If ISDA is coherent, they should also consider the compounding setting in arrears incompatible with the transition period, as this period is equivalent to a weighted sum of historical and spot-spread approaches.
What is the impact on hedging from the transition period? It is good if the fixing dates in the hedge are close and some are before the discontinuation and others are after (date cliff-effect). The impact is bad if the fixing dates are in the transition period and LIBOR is hedged with ON derivatives (one specific day LIBOR volatility is exacerbated by the transition period).
Summary: There is no cliff-effect due to the spread when the cessation date is known, there is a cliff effect on the choice of announcement and cessation dates. The announcement date is an option in the hands of the panel banks. With the transition period, there is a risk of unusual market condition and potential manipulation, size 125, on the last fixing.

Comments
Post a Comment