Fallback and transition period
A recent comment in Risk describes some consequences of the selected fallback mechanism. The article is titled Beware of cliff edge in Libor fallbacks (subscription required). The comments can be split in several parts. One describes some issues related to LIBOR fallback that have previously been discussed with more details in my blogs and relates to the distribution of historical data and the median effect: LIBOR Fallback: a median in a crisis and Updates on LIBOR/ON spread.
The second one is related to the impact of the discontinuation date. It is important to insist that the so called "cliff effect" is coming from the choice of the discontinuation date and happen on the announcement date, not the optical jump in fixing rate on the discontinuation date . Once the discontinuation date is known, there is no cliff-effect anymore, even if the fixing jumps (from LIBOR to fallback). That was described in Spread, transition period, cliff-effect and manipulation.
As also discussed previously, there is a point on which I disagree: transition period effect.
As part of the consultation on Libor fallbacks, Isda proposed a one-year transition period. This would have transitioned the applied spread linearly from the final published Libor/RFR spread to the historic spread over a one-year period. The transition period would have eliminated the optical fixing jump. It is important to indicate that the transition does not eliminate cliff-edge in valuation. There is no cliff-effect in valuation on the discontinuation date, the "cliff-effect" appeared on the consultation results announcement date, except that this material information was not perceived at the same date by all market participants, leading to a smoothing of the cliff.
The article indicated that "However, the proposal was not adopted due to concerns over its complexity." Why it was not adopted cannot be ascertained as consultation participants had not to provide that information and in any way the answers have not been made public. I know only one actual reason, that is mine, and it has nothing to do with complexity but has to do with manipulation. Transition period introduce a (weighted) spot spread adjustment which is prone to manipulation (and unwanted volatility). The spot spread adjustment approach has been refused by a very large majority of the consultation respondents; to be coherent the transition period has also to be refused.
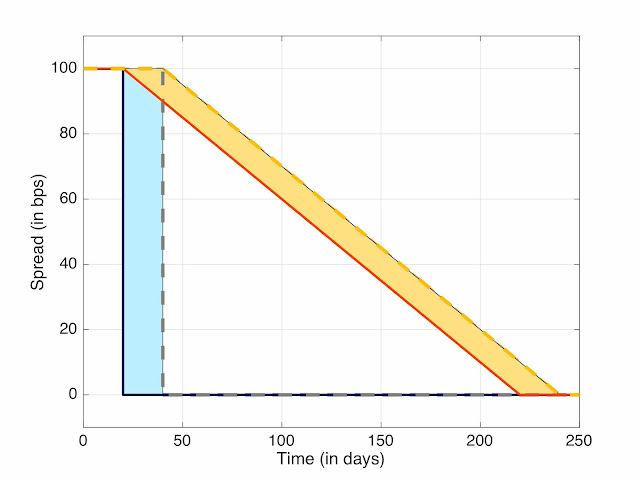
Beyond this anecdotal wording about complexity, the main claim of the paper is that the transition reduces the impact of the uncertainty on date. This is "demonstrated" by an example where there is a larger jump on some fixings. While I agree on the larger size of the jump, I disagree on the global impact. The global impact is not reduced by the transition period. To see why, let's look at a graph similar to those presented in the articles. For simplicity, I have introduced only two possible discontinuation dates, many dates is simply a probability weighted combination of the scenarios.
Suppose that the difference in discontinuation dates between the scenarios is n days and the transition is over t days with a spread of s. In the no-transition case, the spread is applied to the days for which we had an incorrect assessment of the fallback, the impact is thus n x s. In the transition case, the situation is a little bit more complex, as the error in rate will apply not only on the incorrect days but to the full period up to the end of transition. The error is thus the length of the transition multiplied by the error on each of those days and the spread, the impact is thus t x n/t x s = n x s (see figure below). The total impact is the same. The advantage is that the error is spread over many more days. So a market makers that has random payer and receiver fixing will have less volatility in the impact. But for a one-sided party with many daily fixing, like an asset manager or a pension fund, the impact is the same.
Figure 1: Fallback spread and transition period.
The first scenario is the continuous lines: dark blue for the no-transition and red for transition. The second scenario is the dashed lines: gray for the no-transition and yellow for transition. The two surfaces represent the fixing impacts (blue without transition, light yellow with transition); the two surfaces have the same area.
As mentioned before, the main impact is about volatility and manipulation. Because one day fixing is used on a long period, up to 250 times, the incentives that existed on manipulated the rate are multiplied by 250 (125 with the weights). As we know that the panel banks will have both the discontinuation date option and the manipulation option, why would you take that risk? Also there is the volatility risk: one day fixing will impact 250 days. So a special event on that day (think pandemic, year end issues, default, election) will have a lasting impact. Again why taking that risk if it does not bring material advantages.


Comments
Post a Comment